Card, mobile credential, payment and security
Data can help institutions shape service offerings to increase student satisfaction and retention
Each year, the Student Financial Experience Report commissioned by TouchNet provides a unique glimpse into college students’ payment, ID, and campus service preferences.
The 2025 study includes responses from 3,245 undergraduate students from the U.S., U.K., Canada, and Australia. It explores how students navigate various campus financial systems and leverage technology to enhance their campus experience.
Institutions can use the findings to improve student satisfaction and success in areas from payments to auxiliaries and card programs to security.
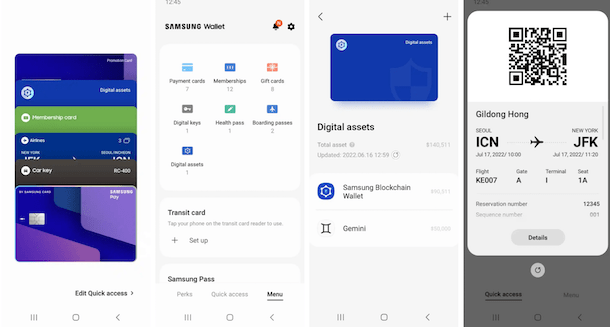
For everyday purchases like food and entertainment, 55% of U.S. respondents say they “always” or “frequently” use mobile pay (e.g. Apple Pay, Google Pay) over other forms of payment.
General topic areas include:
For each topic, a series of questions was presented. A sampling of specific findings is included below, and the full report is available for free download.
More than 55% of U.S. students use three or more different sources to pay their tuition. The top reported sources include personal payment, family support, aid/scholarships/grants from the institution, and federal or private student loans. Each of those are used by about 40% of respondents.
 Students prefer self-service over contacting a person
The migration from face-to-face service delivery to self-service channels is evident in the findings.
Two-thirds of students use their institution’s online portal to pay their personal portion of tuition using bank transfer or card payment. Just less than 25% pay via the institution’s mobile app using online banking, card, or Apple Pay/Google Pay. Only 8% make in-person payments.
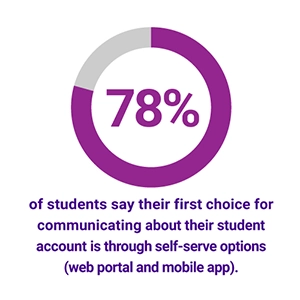
Similarly, the preferred communication methods for accessing student account and tuition payment information are overwhelmingly web portals and mobile apps. Phone and in-person options are far less popular.
For everyday purchases like food and entertainment, 55% of U.S. respondents say they “always” or “frequently” use mobile pay (e.g. Apple Pay, Google Pay) over other forms of payment. For bill payments like rent, utilities, and phone this number drops, but remains strong, at more than 40%.
While these numbers are large, mobile payment usage by students in the U.S. lags U.K., Canada, and Australia.
When asked what type of student ID you currently use, 22% have only a mobile ID while 40% have both a mobile and physical ID. More than one-third of all students have only a physical card.
45% of students say they would prefer a mobile ID while 30% would prefer to have both a mobile ID and physical card. One-quarter still prefer a physical card.
In terms of preference, however, 45% say they would prefer a mobile ID while 30% would prefer to have both. One-quarter still prefer a physical card.
The most requested use for a student ID is mobile identification, with more than 50% of respondents naming that as a key use. Following mobile ID, traditional use cases including building access, meal plans, campus cash accounts, and parking are ranked as important at roughly 35%.

Higher ed is recognizing the potential for data from transaction and access systems to provide insights into student behavior and deliver better services. But do students see this as intrusive or enabling?
When asked, “What is your opinion about your institution actively tracking and using student ID data to improve campus amenities,” most students were on board. Assuming there was transparency and it led to improved services, more than 85% support the efforts.
Another question asked students to specify up to three services that their institution could improve with technology. The top answers related to payments, with “tuition and financial aid processes” topping the list. More than one-third of U.S. respondents place it in their top three.
Academic support services, security/access, dining, campus stores, and course registration also rank high, each making the list for more than 20% of respondents.
There is a wealth of additional information in the study that can provide insight into student preferences for digital solutions, payments, physical and mobile ID, and more. Understanding what your students really want can help you steer product and program offerings in the direction that can increase student retention and satisfaction.
Download Now